CSS Class Highlighter
A CSS workbench on the page you’re building: inspect an element, follow its classes, compare styles and explore design tokens.
- Platform
- Chrome extension
- When
- Mar to May 2025
- Role
- Sole developer
- Version
- 4.1.0, 13 Oct 2026
- Price
- Free
- Status
- Live on the Chrome Web Store
How it works
4 steps- 01
Open the workbench
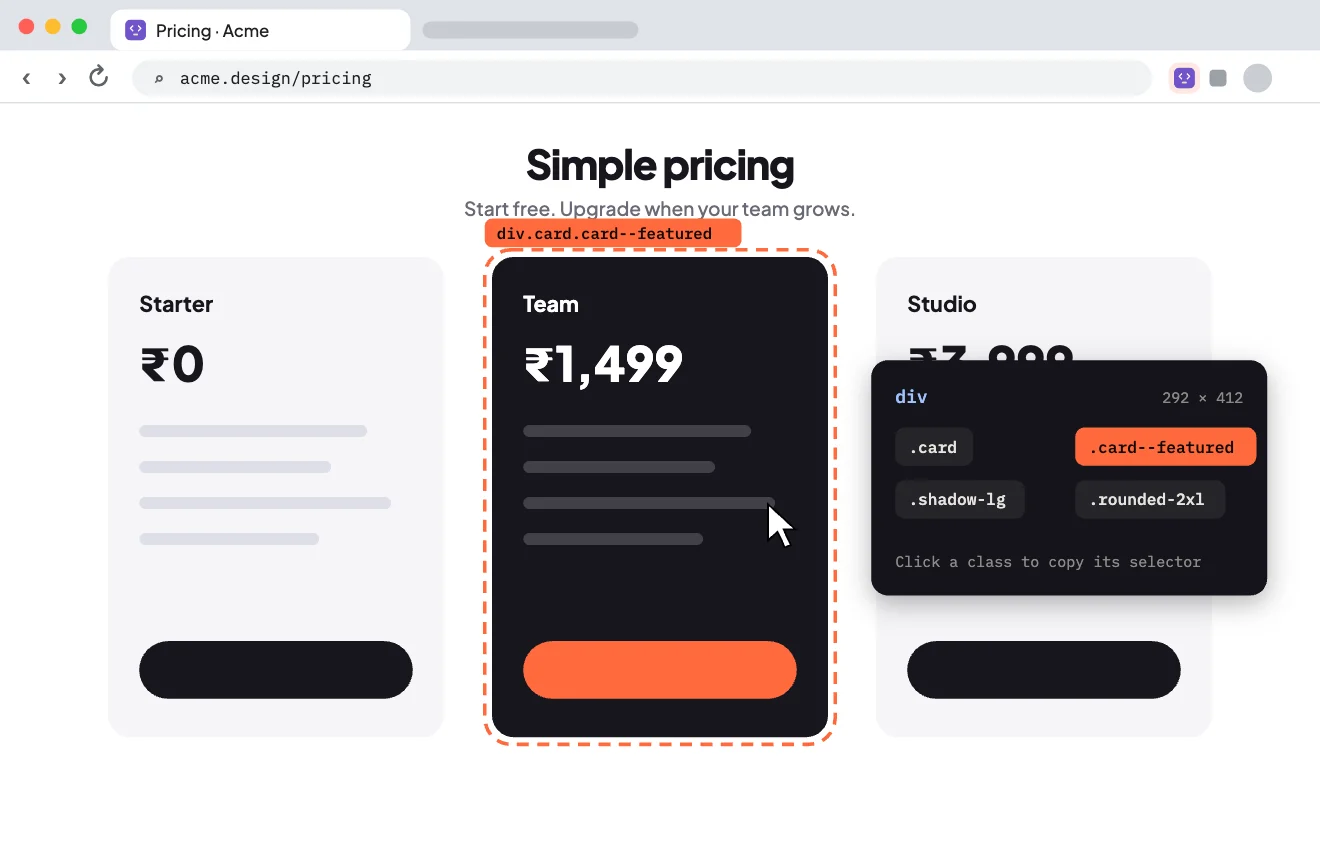
Choose Inspect page from the toolbar, the right-click menu or Alt+Shift+C, on any regular webpage.
Open larger: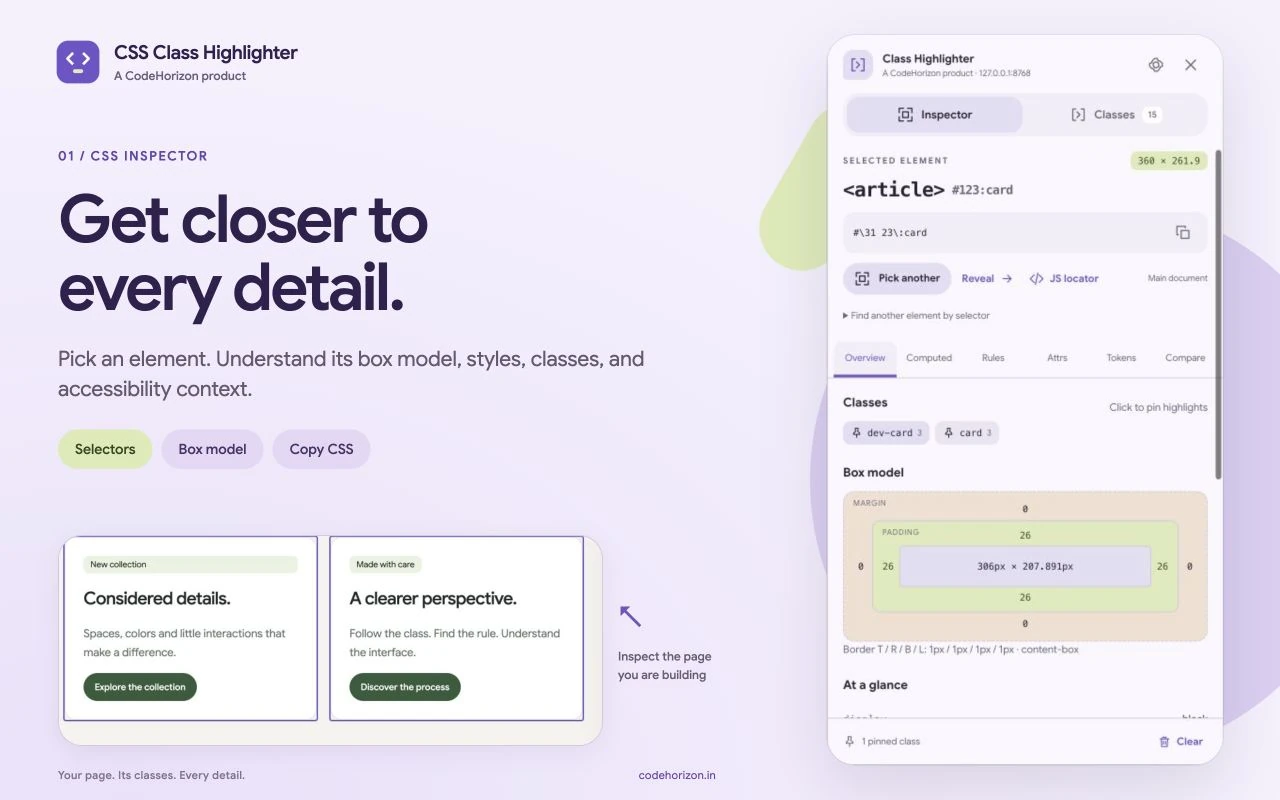
- 02
Pick an element
Read its selector, box model, computed styles, readable CSS rules and attributes, and copy a selector or a JavaScript locator.
- 03
Follow its classes
Search live class counts, preview or pin highlights, jump to matches, and export the list as JSON or CSV.
Open larger: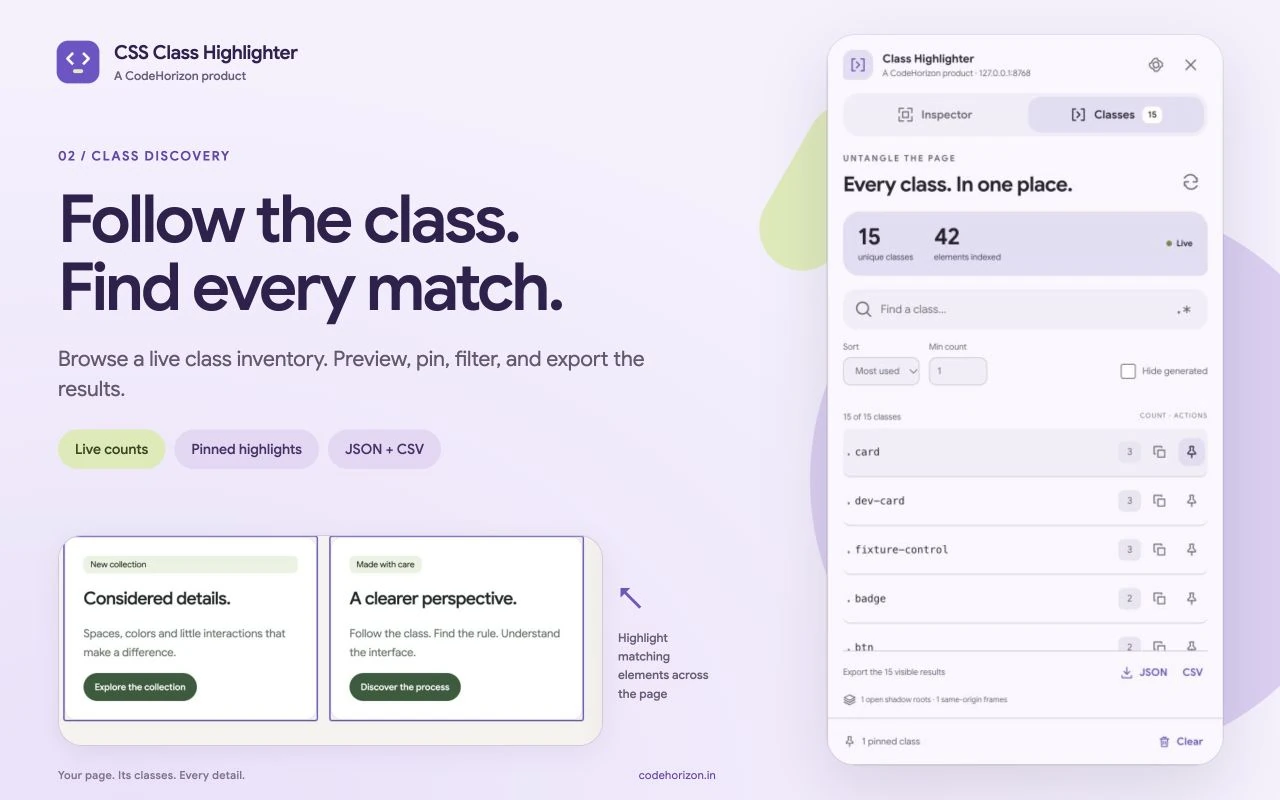
- 04
Compare and explore
Freeze a baseline, see what changed in the CSS, then search the design tokens behind the page.
Open larger: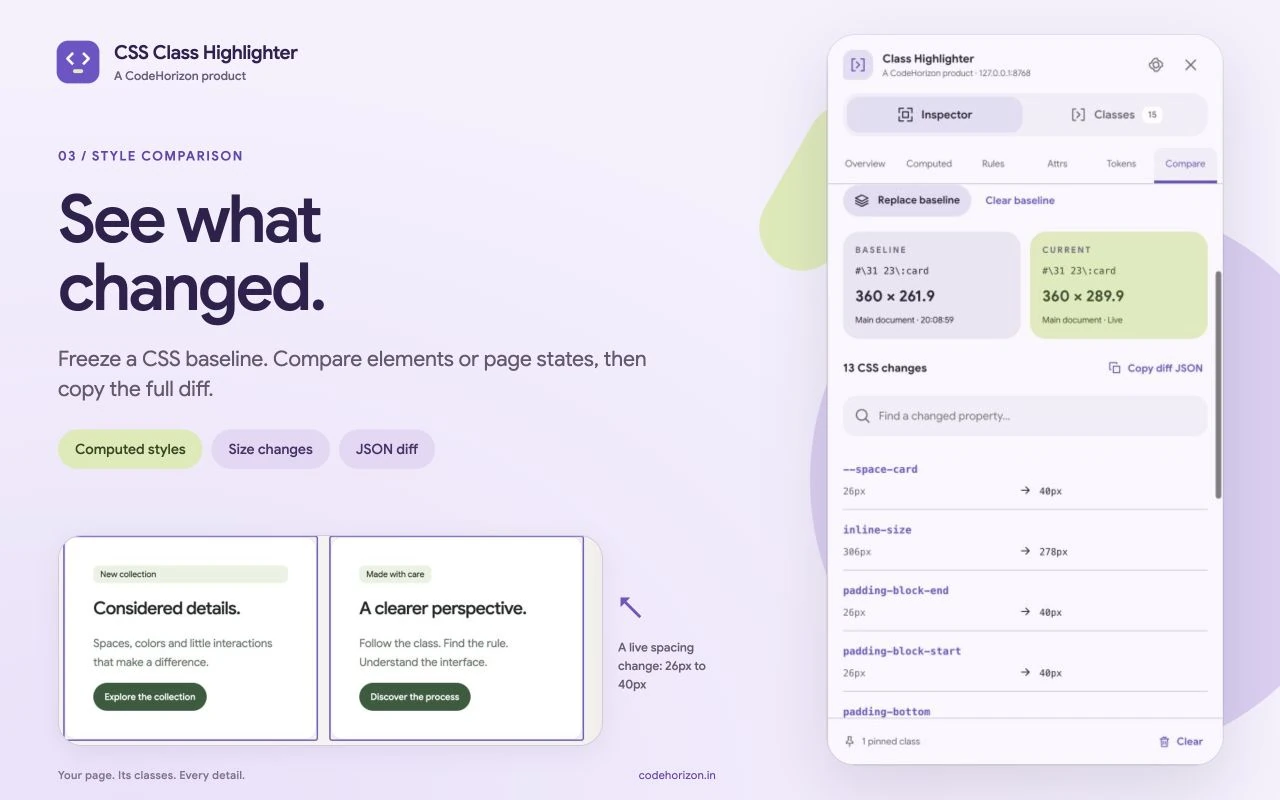
The problem
I once spent twenty minutes in DevTools hunting for the class that was overriding a style in a client’s codebase. Twenty minutes for a thirty-second fix. In DevTools, the class list is buried among everything else. A class name is only part of the story, though. You also need to see where it appears, which styles reach the element, and what changed between two states. Version 4 brings those checks together on the page itself.
What I built
Version 4.1 rebuilds the extension as a developer workbench. Pick an element to read its box model, computed properties, readable matching rules, attributes and basic accessibility context, then copy an escaped selector, its HTML, a CSS snapshot, or a JavaScript locator that keeps frame and open shadow-root boundaries.
A live class inventory covers the document, open shadow roots and same-origin frames. Save a computed-CSS baseline and compare it with another element or a later state, or explore the resolved CSS variables behind a design. The popup, preferences and inspector share one Material Design 3 Expressive interface.
Hard partA full CSS workbench that can open on any page, keep a live index of every class, and still leave that page responsive.
What it does
- 01
An inspector with context
Box model, computed styles, readable matching rules, attributes and basic accessibility details, together.
- 02
Live class discovery
Search and sort every class, filter generated names, and jump from a class to its elements.
- 03
Highlights you can keep
Preview a class or pin several, styled for every site or just one.
- 04
CSS changes, side by side
Save a computed-CSS baseline, compare a later state, and copy the diff as JSON.
- 05
Design tokens in context
Resolved custom properties, inherited values and colour previews, ready to copy.
- 06
Made for daily use
Material Design 3 Expressive, Google Sans, light and dark themes, shortcuts and per-site settings.
Under the hood
- 01LoaderA small script on permitted pages
- 02Service workerLazy activation, serialised storage
- 03EngineTraversal, a live class index, CSS inspection
- 04WorkbenchReact, inside its own Shadow DOM
Bounded by design
Regex search accepts up to 200 characters with one repetition, the index stops at 100,000 elements, and rule inspection scans at most 6,000 rules for up to 200 matches, so a heavy page stays responsive.
Highlights that keep up
Pinned highlights follow scrolling and layout changes, skip matches that are off screen, and respect a visible limit you set.
Preferences that never collide
A site override stores only the fields you changed, so later global changes still apply. Writes are serialised and briefly batched to avoid conflicts and excess Chrome Sync calls.
A careful upgrade
Version 3 site settings migrate to the version 4 schema, and an old record is removed only after its replacement has been saved.
Decisions
- 01
Load the workbench only when it’s asked for
A lightweight loader is all that runs on the pages you browse, so everyday browsing pays almost nothing for the extension.
Trade-offThe first open on a page waits a moment for the workbench to load.
- 02
Give the workbench its own Shadow DOM
Whatever site it opens on, page styles can’t restyle its controls. Version 3 had tried a shadow root and dropped it; version 4 is built around one from the start.
- 03
Hard limits instead of scanning everything
A huge page or a costly pattern should never freeze the page being inspected.
Trade-offMatching rules are a source view. Chrome DevTools is still the place for full cascade order, pseudo-elements and complex nested selectors.
A bug I remember
A panel that flickered forever
- What it did
- In version 3, the floating panel flickered without end as soon as the pointer went over it.
- Why
- Pointing at the panel made the panel the element being inspected, which redrew it, which fired another
mousemove: a loop, sixty times a second. - The fix
pointer-events: noneon the whole panel. It only shows things, so the pointer passes through to the element underneath.
What I tried first
A DevTools panel
The first version was one. It worked, but needed DevTools open, which defeated the point.
A shadow root for the panel
In version 3 it kept the page’s CSS out, but also blocked events that click-to-copy needed, so a normal element with tightly scoped class names won. Version 4 went back to one, built for it from the start.
What I learned
- If the panel receives its own hover events, it flickers in a loop. Pointer events have to be intercepted selectively.
- Shadow DOM and iframes are hard boundaries, and SVGs don’t always have a usable
classList.
Timeline
First version
Inspect Mode, the class list, and copying a selector.
3.2.8
Settings for each site, with options to hide hashed class names.
4.1.0 goes to review
A rebuilt developer workbench is submitted to the Chrome Web Store.
4.1.0 is live
CSS comparison, design tokens, a live class inventory and exports, with Material Design 3 Expressive and Google Sans.
Built with
TypeScriptReactViteManifest V3Shadow DOMChrome Sync
Your dataPage inspection runs in your browser, and nothing is sent to CodeHorizon. Preferences, and the sites you customise, are kept in Chrome Sync. No accounts, ads, analytics or remote code.
Every screen
5 from the store listing- Open larger:
01Element inspection, box model and CSS context
- Open larger:
02Live CSS class discovery and pinned highlights
- Open larger:
03Computed CSS comparison with a 26px to 40px spacing change
- Open larger:
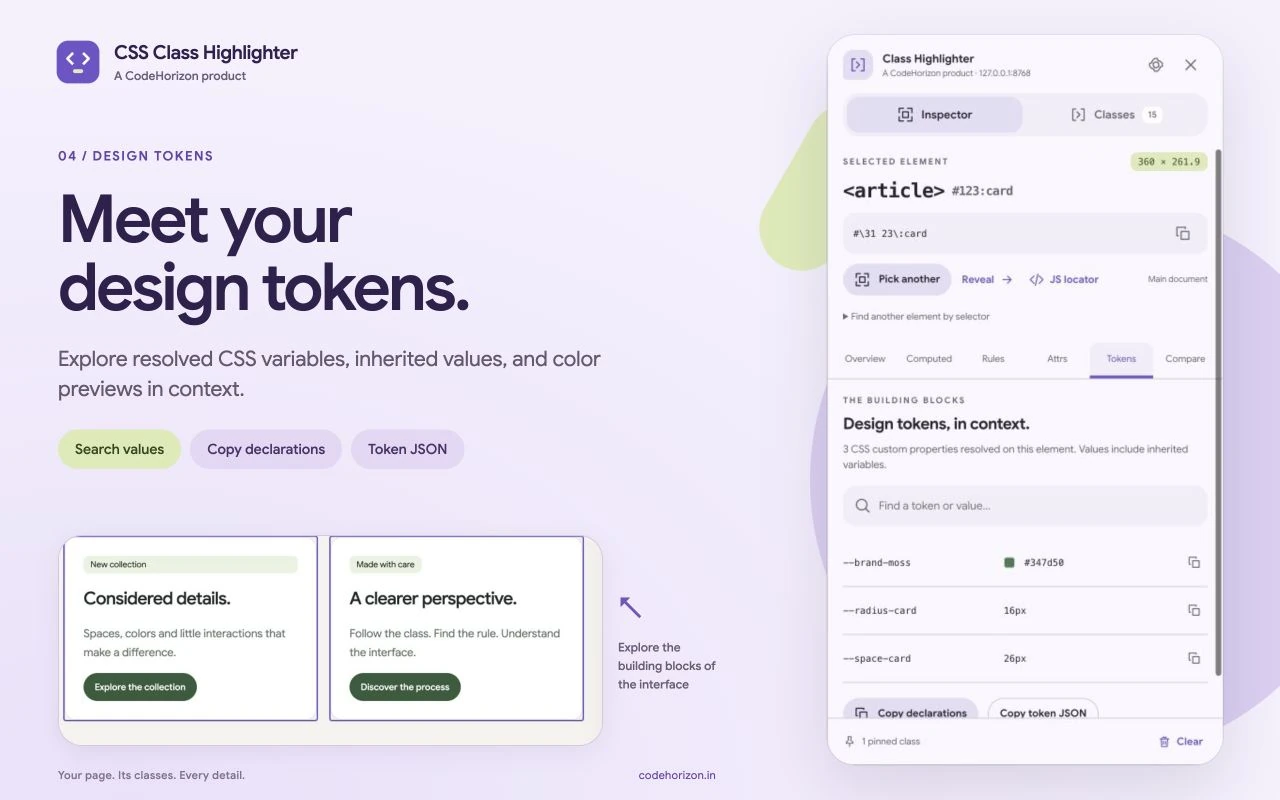
04Inherited design tokens and resolved CSS variables
- Open larger:
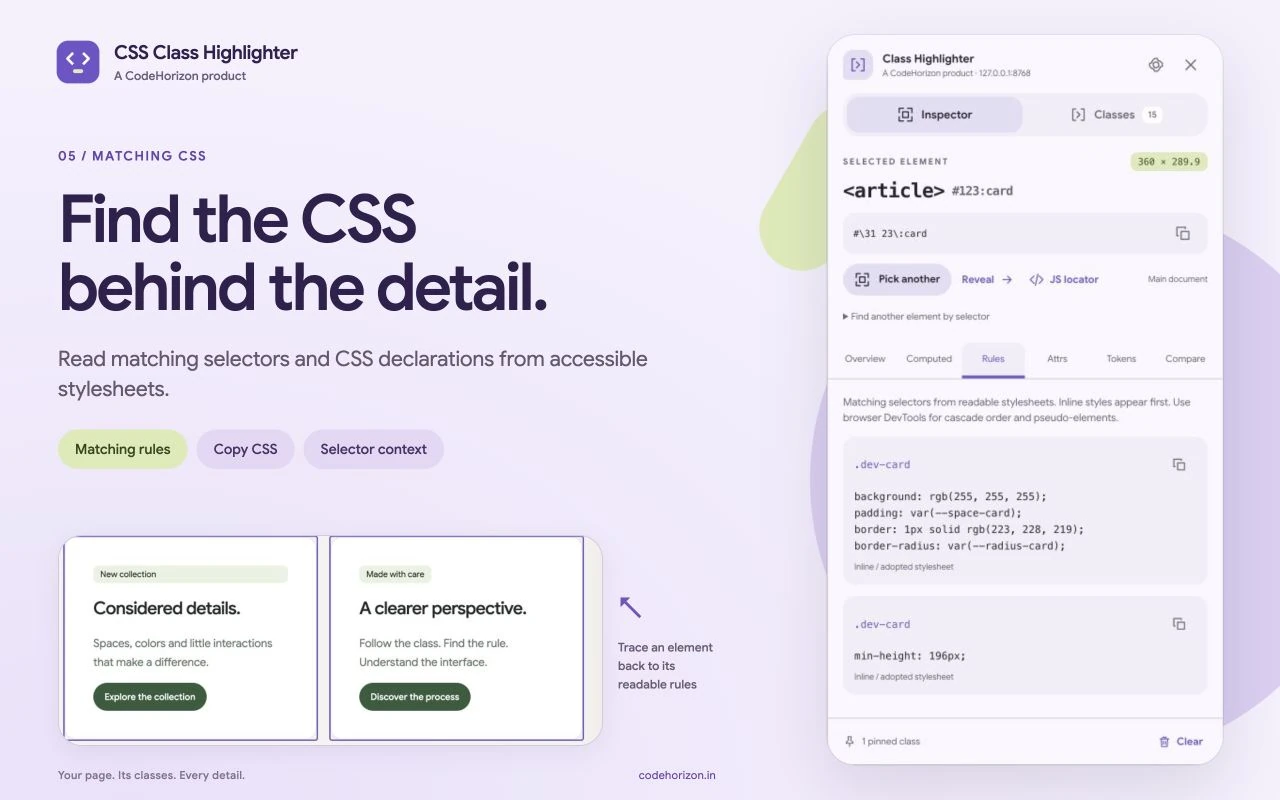
05Matching selectors and readable CSS declarations